
Flutter DevTools
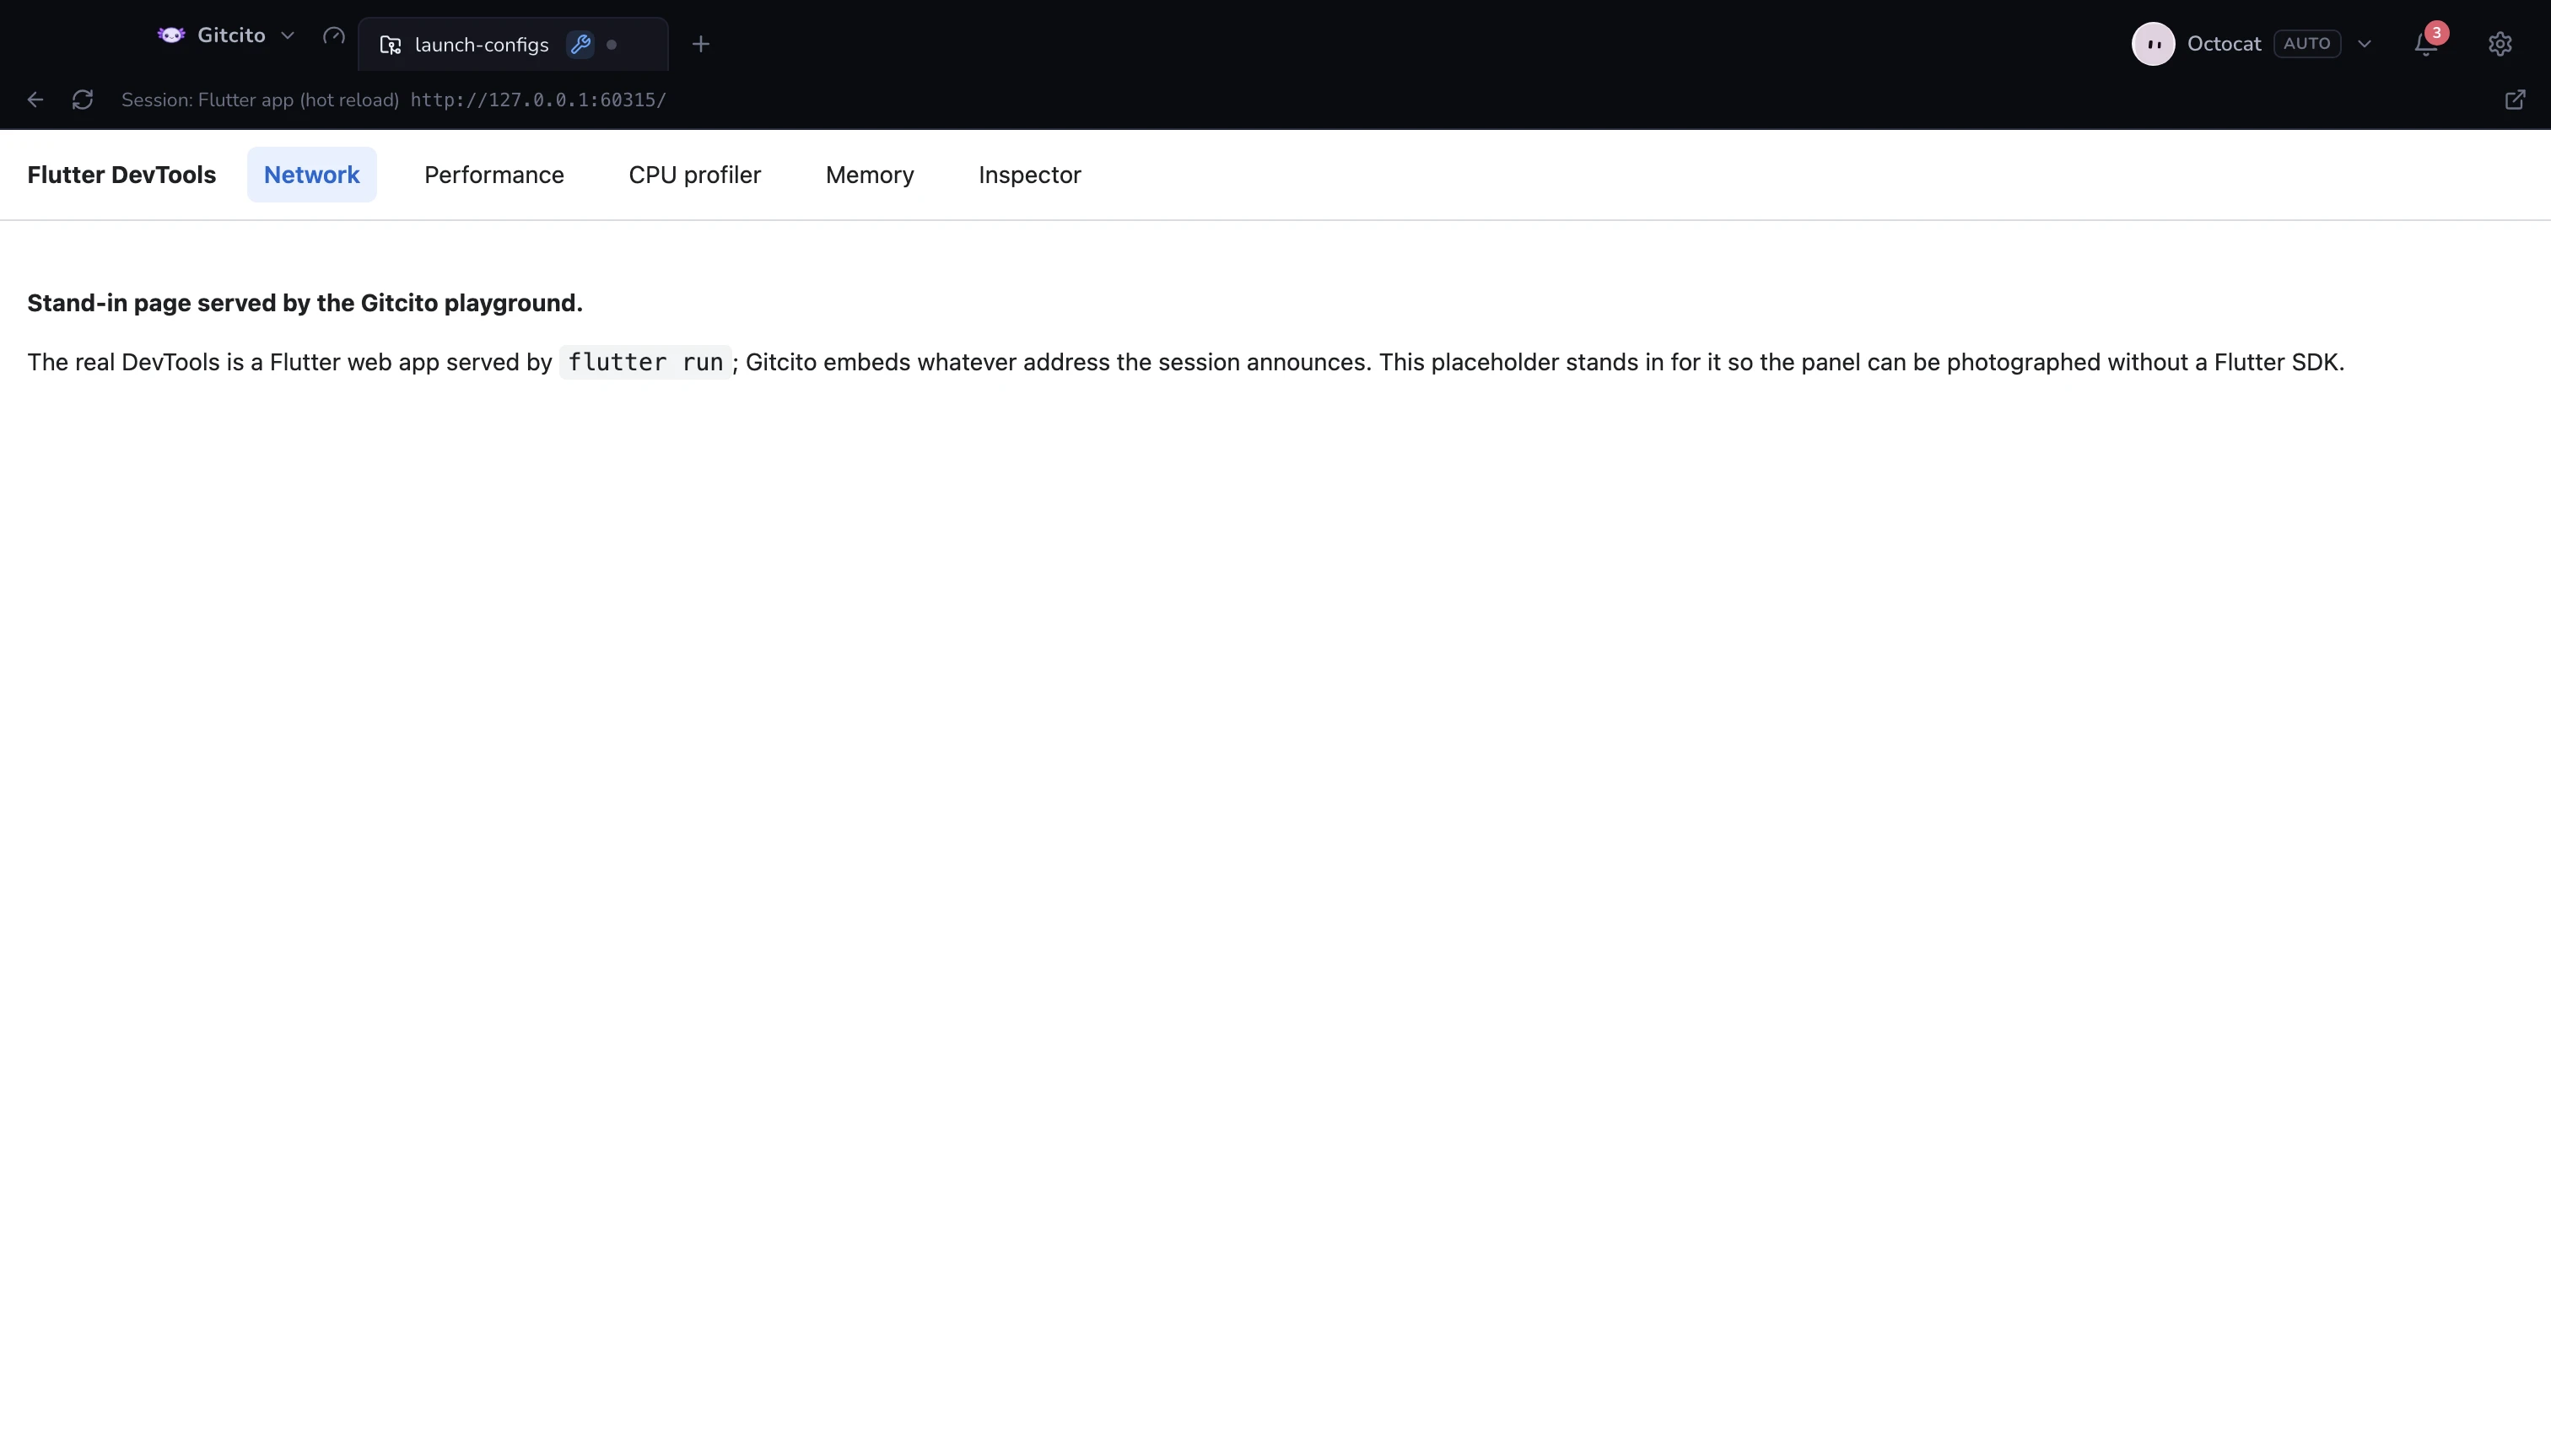
DevTools already has the network view, the timeline, the widget inspector and the memory profiler, and it is a Flutter web app served on your own machine. So Gitcito does not re-implement any of it, and does not talk to the Dart VM Service itself: it notices the address and embeds it.
flutter run prints the line the moment the VM service is up:
The Flutter DevTools debugger and profiler on iPhone 16 Pro is available at:
http://127.0.0.1:9100?uri=http://127.0.0.1:53412/uJ8k=/
The launch session watches its own output for it, and the debug toolbar grows a button. Click it and DevTools opens on the repository itself, as one of its icons rather than a tab of its own. One icon per session — two apps running at once are two DevTools.
A hot restart publishes a new address, and the panel follows it while its session lives. Once the session is gone the panel keeps the last address it had, which is usually dead: close the icon and open DevTools again from the new run.
Which tools
A tool earns a place here by doing two things: serving a web UI on this machine, and printing its address.
| Tool | The line it prints |
|---|---|
| Flutter DevTools | The Flutter DevTools … is available at: <url> |
Dart DevTools (dart devtools) |
Serving DevTools at <url> |
Vue DevTools (@vue/devtools) |
Vue Devtools … listening on <url> |
| Prisma Studio | Prisma Studio is up on <url> |
| Drizzle Studio | Drizzle Studio is up and running on <url> |
| webpack-bundle-analyzer | Webpack Bundle Analyzer is started at <url> |
| anything else naming DevTools and an address | falls through to a generic match |
What cannot be embedded, and why. The Node inspector prints a ws://
endpoint for a debugger to attach to, not a page — and the Chrome DevTools front
end it pairs with lives behind a devtools:// URL that no embedded view is
allowed to load. React DevTools' standalone build is its own desktop window, not
a served page. Neither can be a tab here; both would need a debug-protocol client
rather than an address.
A dev server is not a dev tool. Vite on :5173 is your app, and embedding it
would be a preview panel — a different feature, deliberately not this one.
What it is allowed to do
The embedded view is on a short leash, because this app holds credentials:
- Loopback only.
127.0.0.1,localhost,::1. An attach with any other address is refused, and so is a redirect to one. - No preload, no node integration, context isolation on. The page has no bridge into Gitcito.
- Links open in your real browser, in a normal window, not inside the panel.
The limits
- It is DevTools, not ours. Whatever that version can do, the panel can do; whatever it cannot, neither can we. There is no Gitcito-flavoured network view.
- Only Flutter announces itself this way. A plain Dart program prints a VM service URL but no DevTools address, so no button appears.
- A blank panel means the app stopped. DevTools is served by the running app; when the app exits, its address stops answering.
See also: Run & debug