
Insights
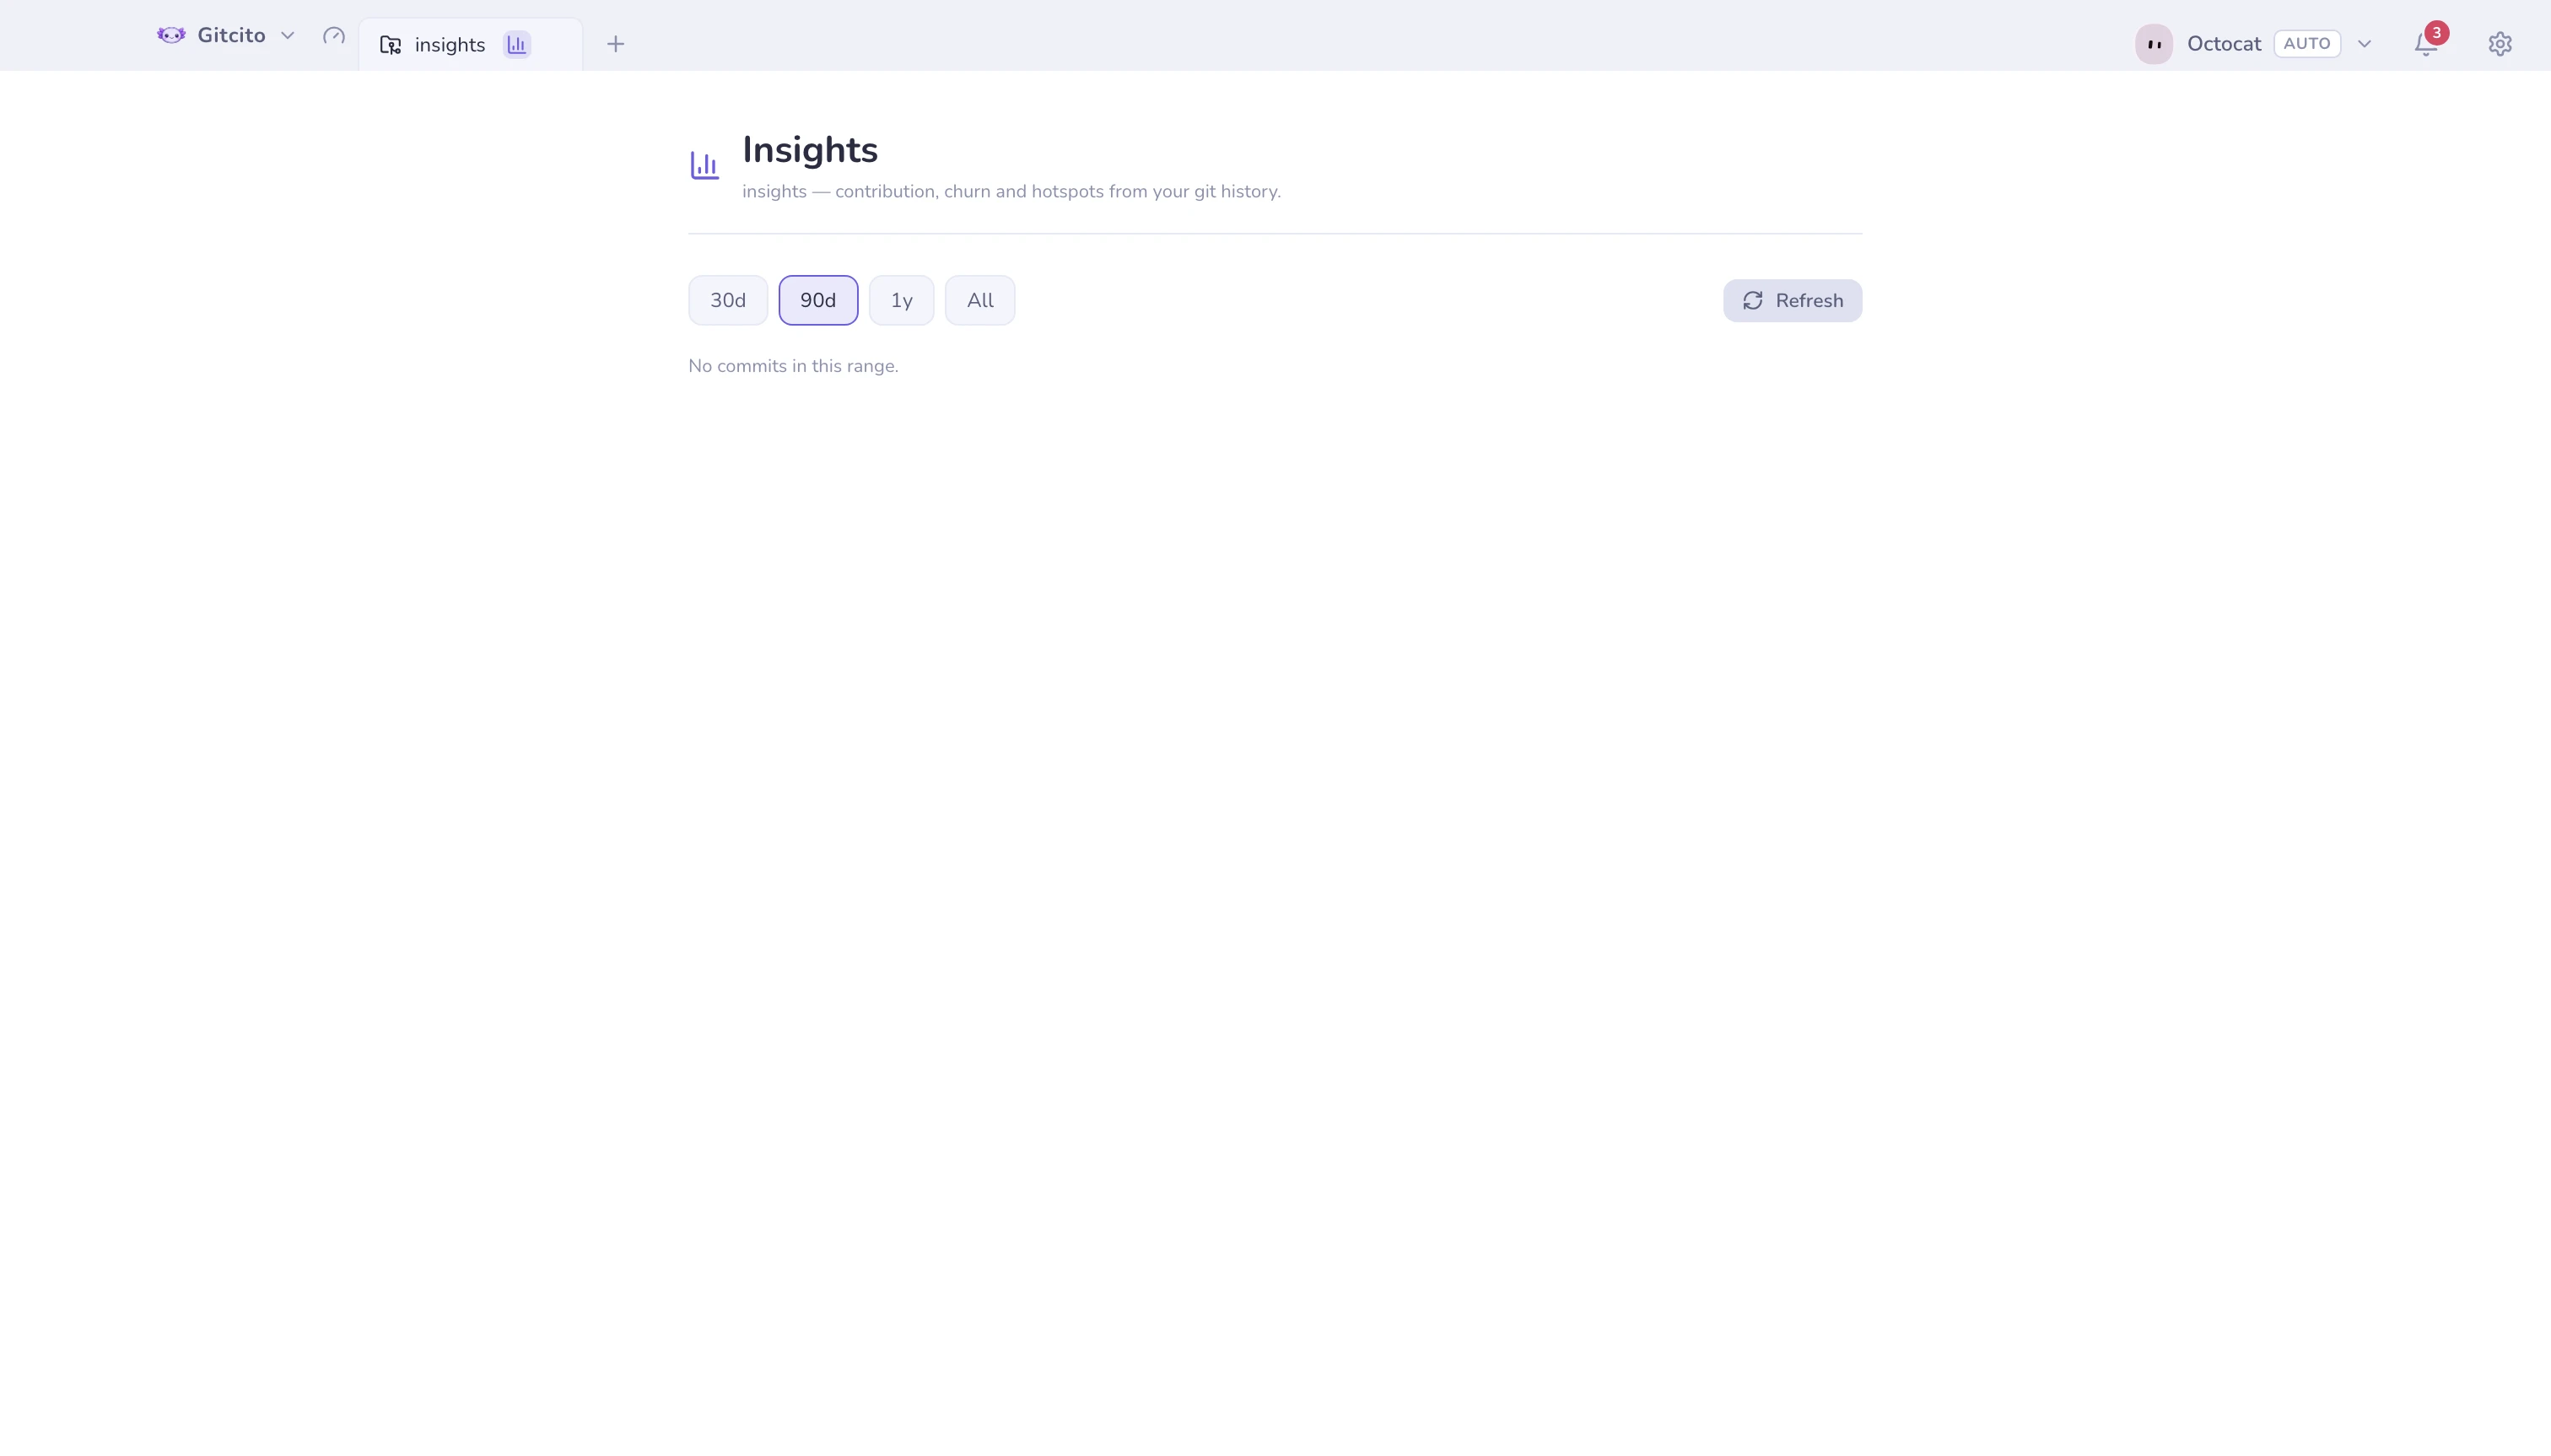
A dashboard built from your Git history — no service, no account, just git log
read locally. Open it from the repo-settings gear next to the toolbar tools.
| Panel | What it tells you |
|---|---|
| Summary cards | Commits per day, contributors, files touched, lines changed |
| Weekly churn | Additions against deletions, week by week |
| Top contributors | By commits and by lines |
| File hotspots | The most-changed files — click one to jump into its history |
Filter the whole thing by 30 days / 90 days / 1 year / all time.
Hotspots are the interesting panel: a file at the top of that list, week after week, is usually telling you something about the design rather than about the people editing it.
For the same history as a moving picture, see timelapse.
See also: Timelapse · Blame & file history