
Problems
Every project already ships a tool that will tell you what is wrong with it —
tsc, dart analyze, ESLint, Clippy, go vet, Ruff. What none of them will
tell you is whether your diff is what introduced the forty warnings it just
printed. Gitcito knows which files are dirty, so the same list answers that
question with one toggle.
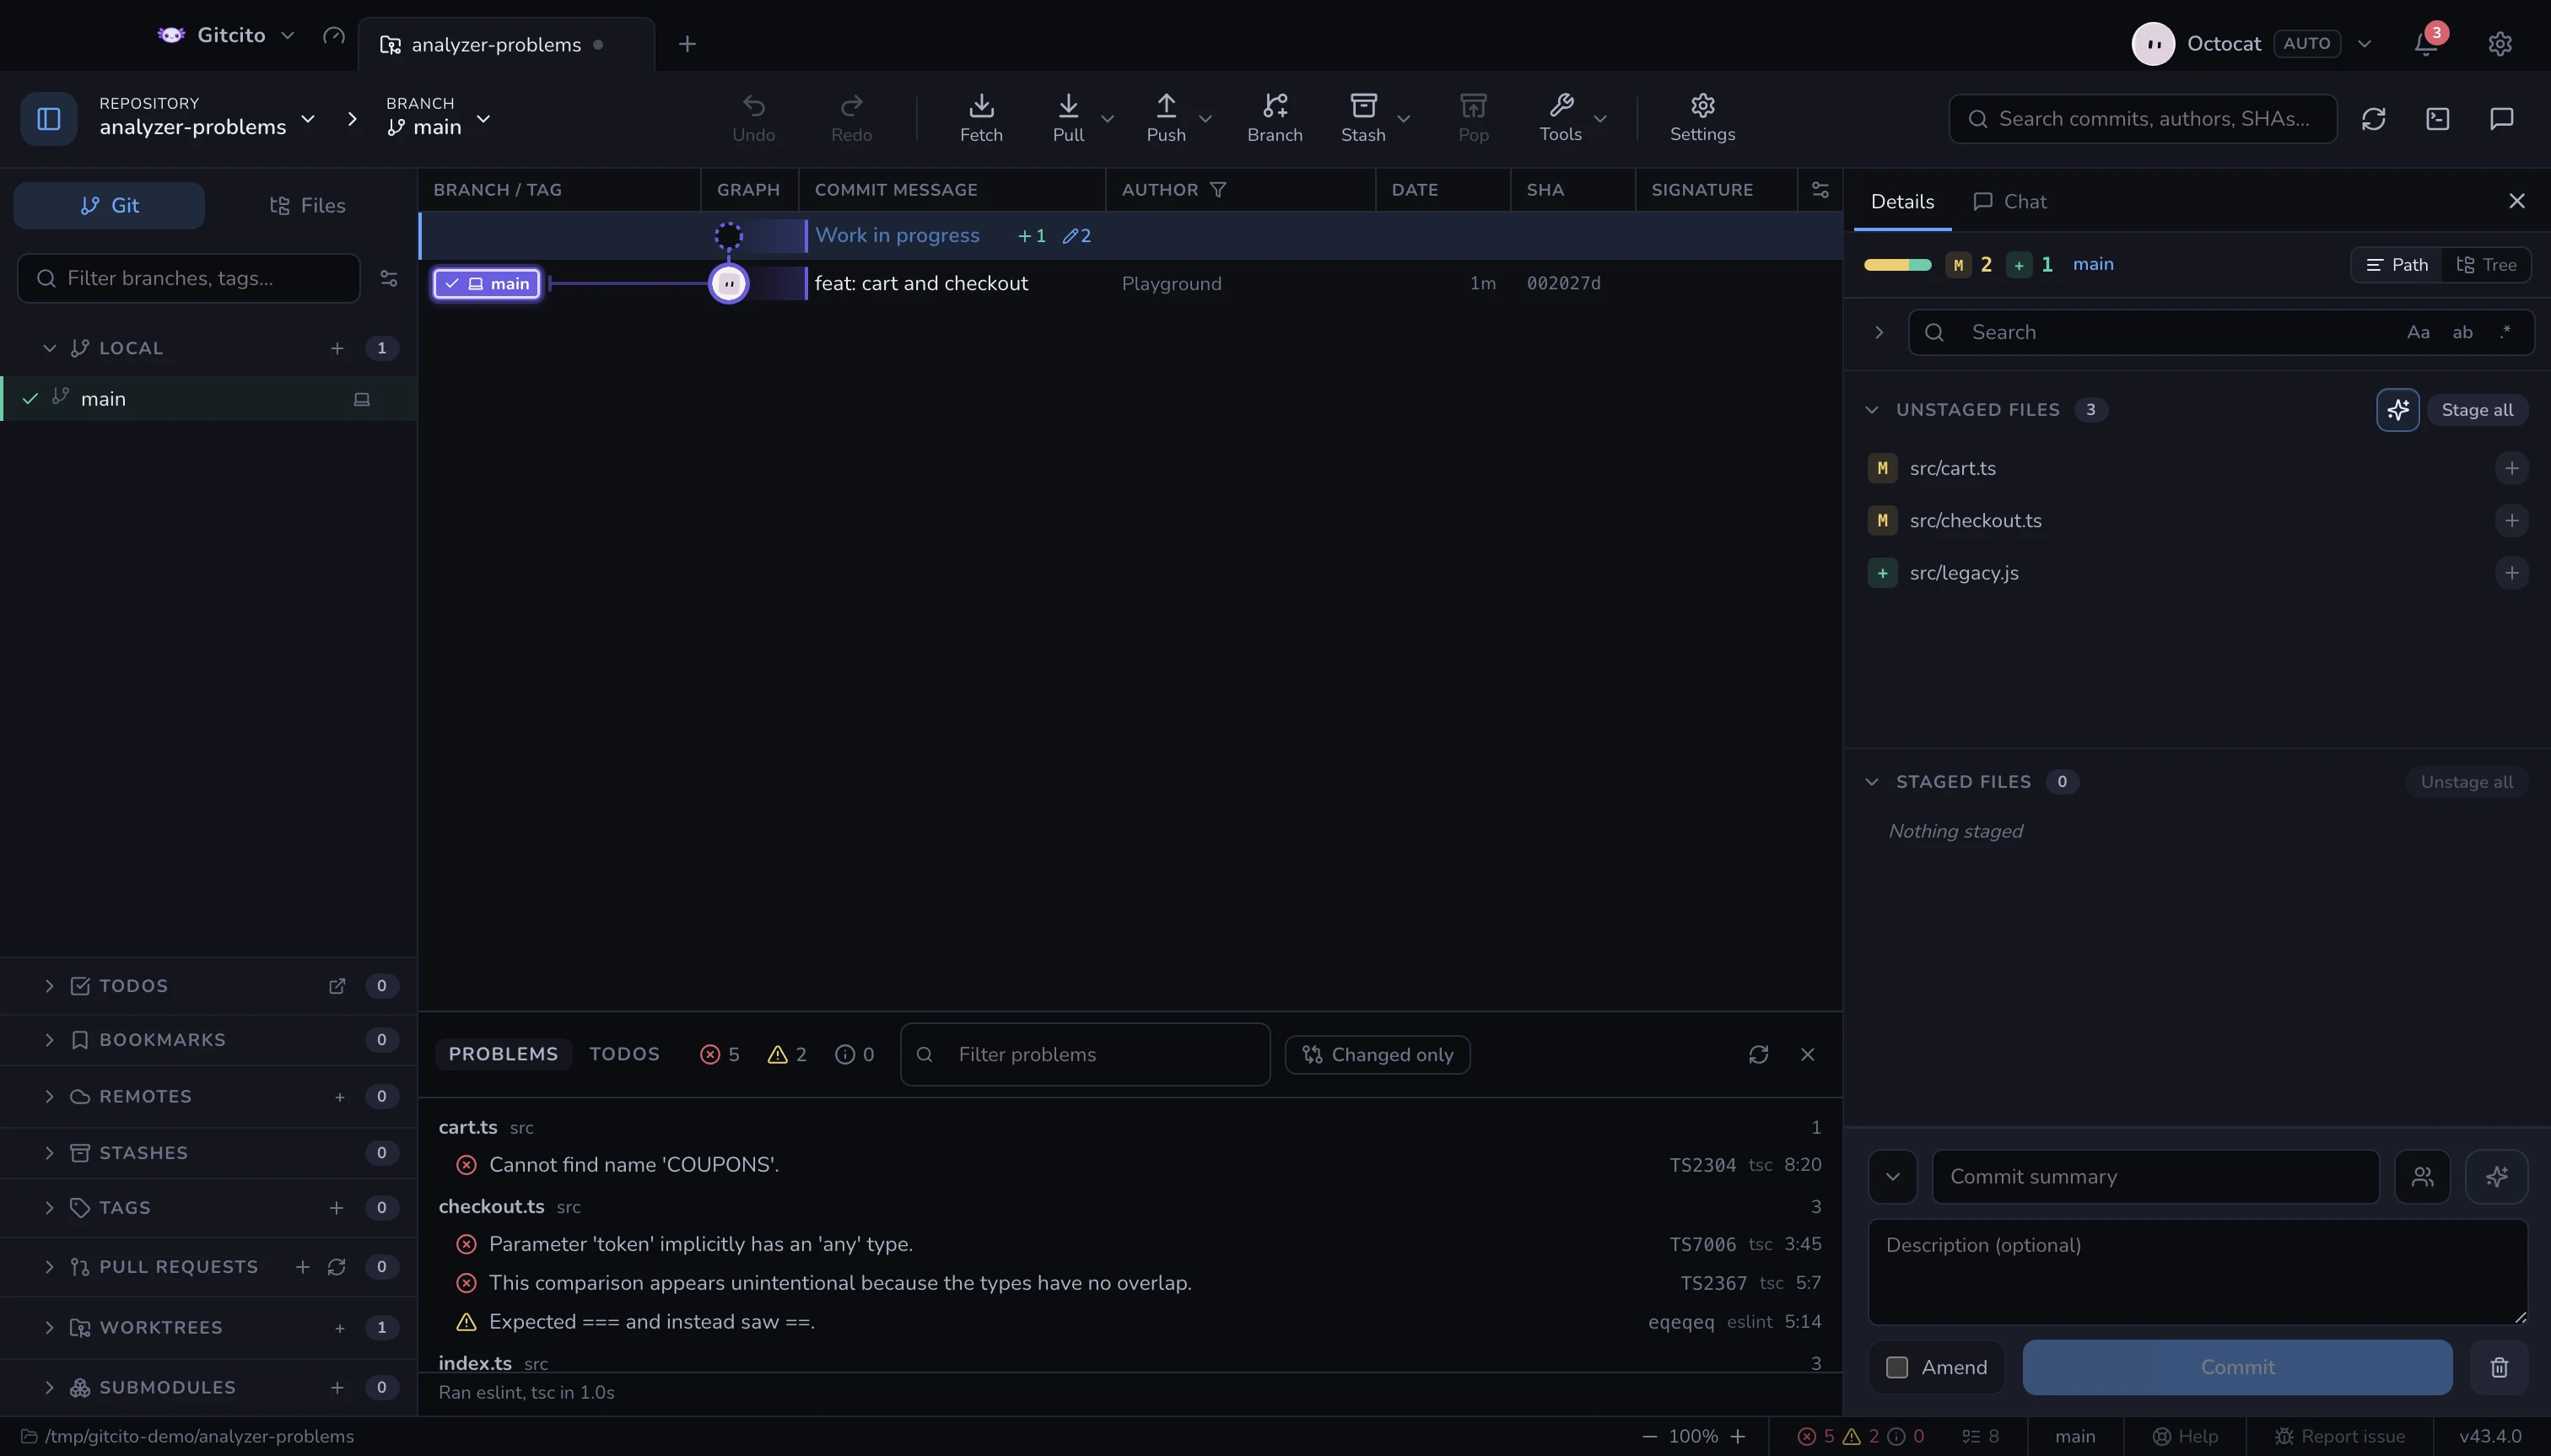
The status bar carries the count — errors, warnings, infos, the three figures VS Code taught everyone to read. Click it (or the command palette's Problems) and the dock opens at the bottom, grouped by file. Clicking a line opens the file there. Before the first sweep it shows dashes rather than zeroes: nobody has looked yet, and three zeroes would claim otherwise.
What it runs
| The repo carries | Gitcito runs |
|---|---|
pubspec.yaml |
dart analyze --format=machine |
tsconfig.json |
tsc --noEmit |
| an ESLint config | eslint -f json |
Cargo.toml |
cargo clippy --message-format=short |
go.mod |
go vet ./... |
pyproject.toml or ruff.toml |
ruff check --output-format=json |
Flutter is covered by the Dart row: a Flutter app is a Dart project, and
flutter analyze calls the same analyzer dart analyze does.
The project does not have to be at the root. Those markers are looked for a
few levels down as well, so a Flutter app under mobile/ or a package under
apps/web is found, and each analyzer runs in its own project directory. A
nested project of the same kind is skipped when an ancestor already covers it —
a root tsconfig.json says exactly that — and a sweep stops at twelve projects,
because a monorepo should not spawn fifty compilers.
A binary in node_modules/.bin wins over the one on your PATH, the same way the
project's own scripts resolve it. Everything runs in parallel, and every tool's
output is parsed into one shape, deduplicated and sorted — two analyzers
reporting the same line produce one row.
Nothing runs by itself. tsc --noEmit on a large repository is tens of
seconds, and these commands are the repository's own toolchain, not Gitcito's.
They start when you open the dock or press refresh, and never on their own. That
is also why the list is a snapshot: edit a file and it is stale until you run it
again.
Settings → General → Code analyzers decides how eager it is: sweep when the dock opens (the default), only when you press refresh, or off — which hides the analyzer half of the dock, its status-bar counter and its command entirely.
Generated output is dropped. A tool pointed at the project root lints
whatever it finds, and what it finds includes .next/build/chunks, a bundled
dist, a vendored copy — hundreds of complaints about machine-written code that
bury the handful about yours. Gitcito asks git which files are ignored and drops
those, and never drops a tracked file: committing generated output is a
choice, and git check-ignore respects it. node_modules goes regardless.
Only what you changed
The toggle in the header drops every problem in a file you have not touched. That is the view worth keeping open: a flat list of every warning in a codebase becomes wallpaper within a week, while "did this diff add these" is a question worth answering before you commit.
The severity chips filter too. Unlit means show everything — lighting one up narrows to it.
The limits
- No language server. This is a sweep, not a daemon: no squiggles as you type, no results before you ask.
- A tool that is not installed is named, not hidden. The footer says what could not run, because an empty list with no explanation is worse than a short one with a reason.
- Only machine-readable output is understood. Each analyzer is parsed from its documented machine format; a tool configured to print something else is invisible here.
- Five thousand problems is the cap. Past that the panel says so and stops — a repository in that state has a bigger problem than a scroll bar.
See also: Local CI · Integrated terminal